How to Set basic Intraday and Delivery chart from Zerodha Kite
As, we all know Intraday trading is not a game for beginners and the selection of segment is also very difficult for most of us so now our team trying to make it simple on the basis of technical indicators which are provided by Zerodha, By using this setup you can earn few points on daily basis. So, let’s start!!
Before we start the zerodha kite chart setting process we would like to remind that this blog is only for educational purpose & subject to market risk where you can get a startup for fresher and there are lots of other setting you can made by yourself
Below are the points that need to be check before placing any order
1:-Buyers and sellers (that can be seen in bid price)
Now we go back to basics economic concepts of demand & supply.
IF DEMAND(BID) > SUPPLY (OFFERS) = PRICE WILL GO UP
IF SUPPLY (OFFERS) > DEMAND(BID) = PRICE WILL GO DOWN
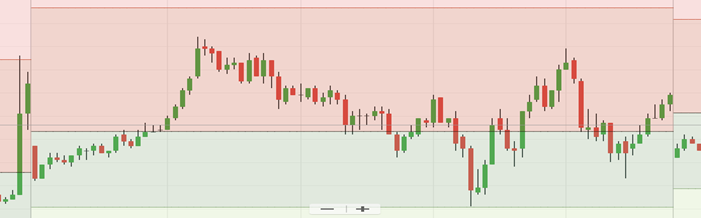
In below case,
Sellers > Buyers
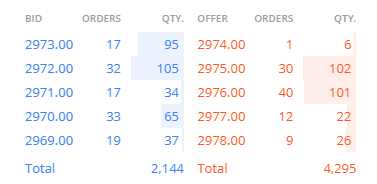
Note:- After SEBI’s new rule the liquidity of bidding goes less compare to earlier
Vice versa if Buyers > Sellers
Now go to Studies/FX section on kite chart
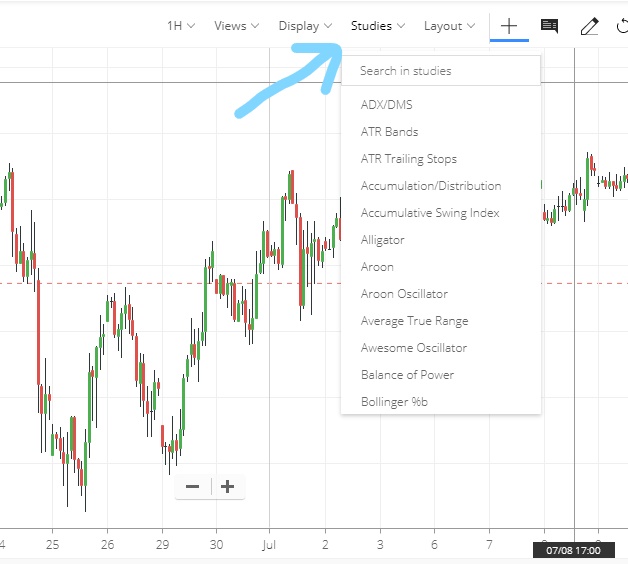
Select Below Indicators Setting (Here you will get lots of indicator, so apply accordingly)
2:- Select Pivot point from the Studies from Kite Chart
With the help of Pivot point we can determine the overall trend of the market on various time frames
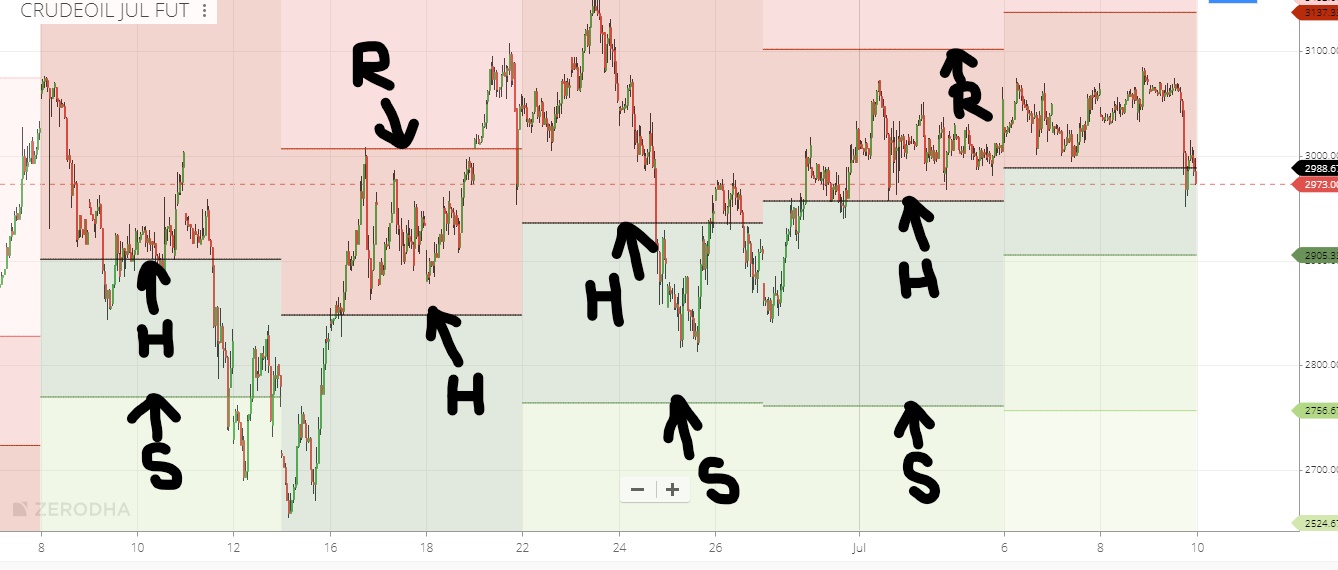
Here in the above screen shows, Below are the terms
H- Horizontal line/ Normal line – Which tells you the trend
R- Resistance – Which tells you the trend may come down after touching it or may continue strong after crossing it.
S- Support – Which tells you the trend may go up after touching it or may continue strong after
crossing it.
When the price/candles go above the Horizontal line, it indicates the trend will be bullish.
When the price/candles go below the Horizontal line, it indicates the trend will bearish.
If candle touches support/resistance level there must be a big chance that trend may reverse and at that time you have to take SL just above/below the support/resistance, if it breaks that level, we can see big movement at there.
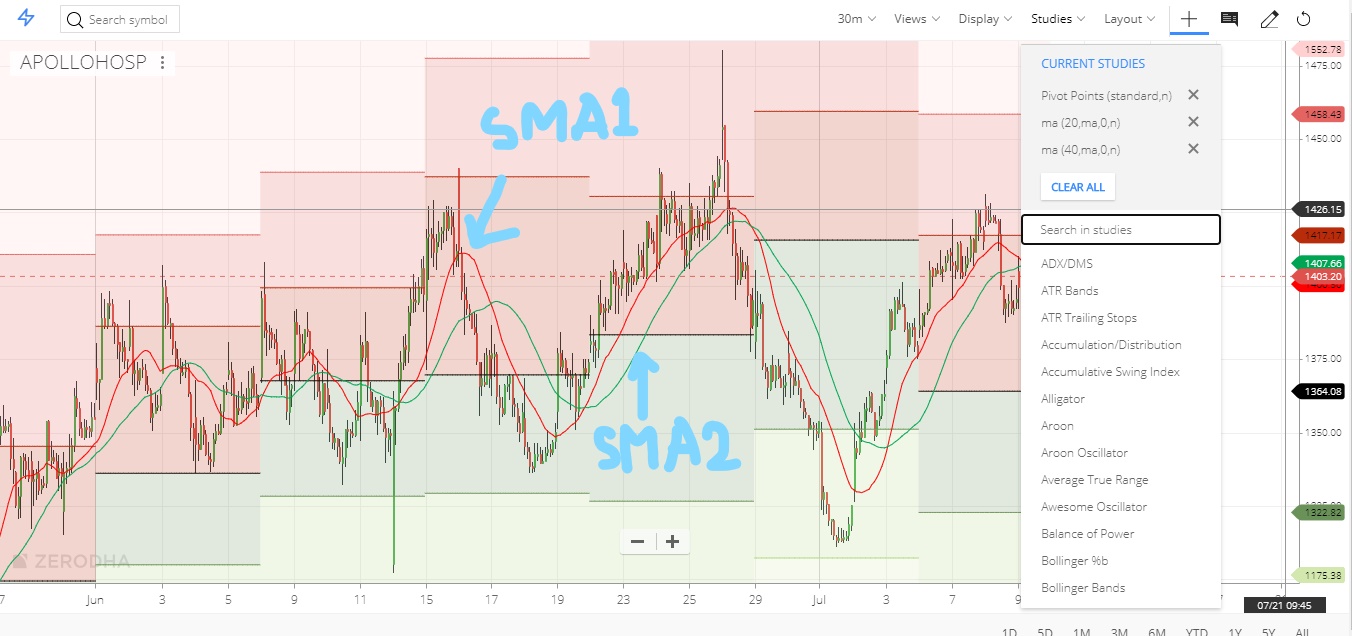
3:- Select the Moving average from Studies in left side of kite chart
- Use SMA1(simple moving average) of period 3 and indicate it as RED color.
- Use SMA1(simple moving average) of period 9 and indicate it as GREEN colour
- Use SMA1 (simple moving average) of period 21 or 12 and indicate it as Purple colour
- Use SMA1 (simple moving average) of period 50 and indicate it as Pink colour
- Use SMA1 (simple moving average) of period 100 and indicate it as Blue Colour
- Use SMA1 (simple moving average) of period 200 and indicate it as Black colour (Can be used as Stop Loss)
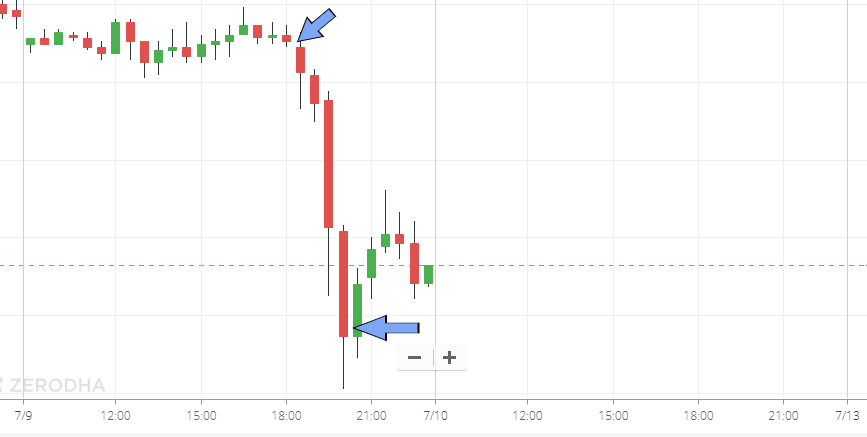
- USE Every time, when SMA1 intersect SMA2 from downside it means Stock will rise
And when SMA1 intersect SMA2 from upside it means Stock will go down 
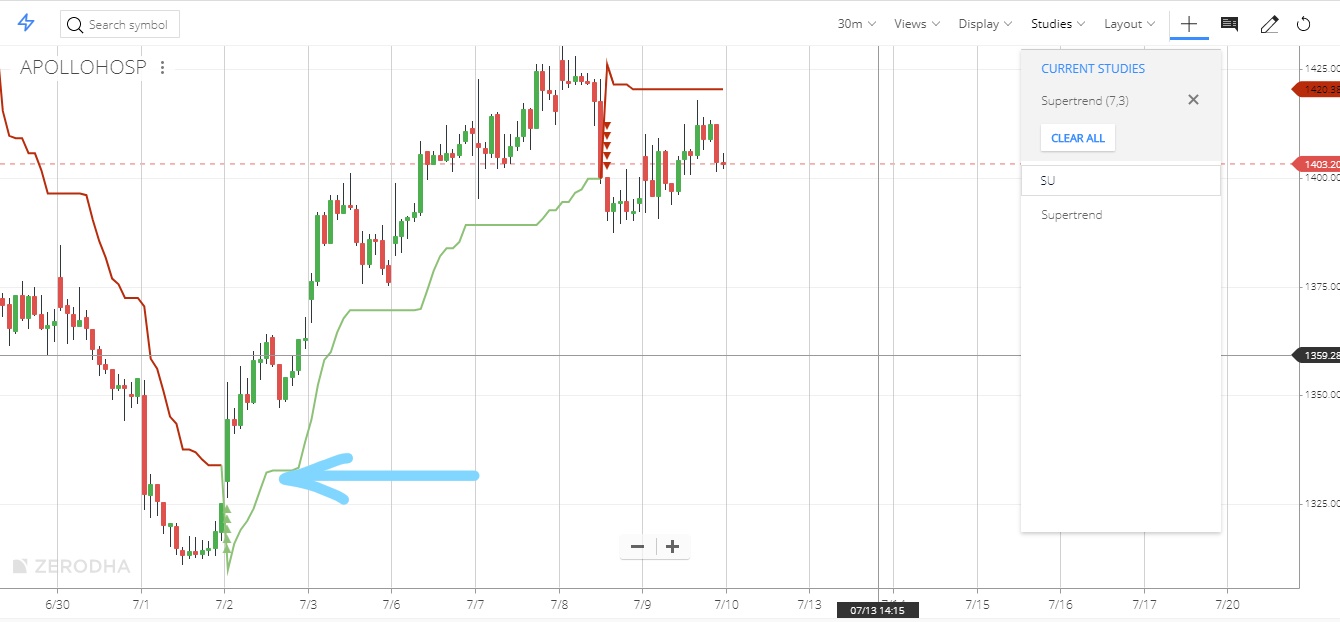
4:- Select the Super trend from studies from Kite chart
If moving average crossover exist for time and you see green line is going up then super-trend will give a signal then it’s a buy call (It totally depends on respective time fraim 5,10,15(minute candle for intraday ), 1d candle for Positional Call (PC)
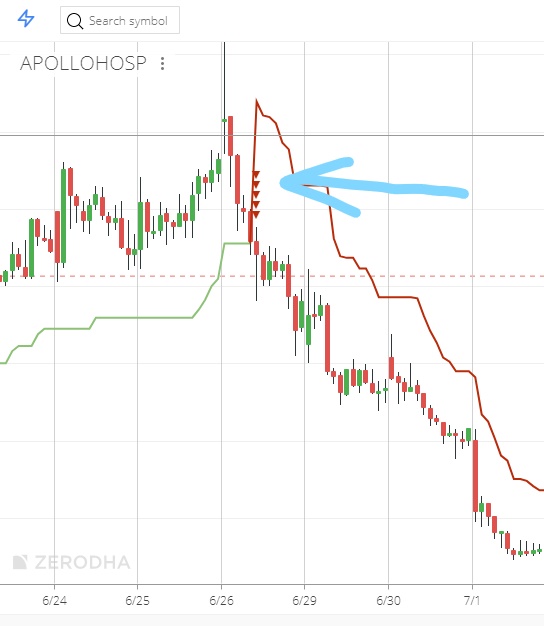
Super trend (if moving average crossover exist for time and you see red line is going down then super trend will give a signal then it’s a sell call)
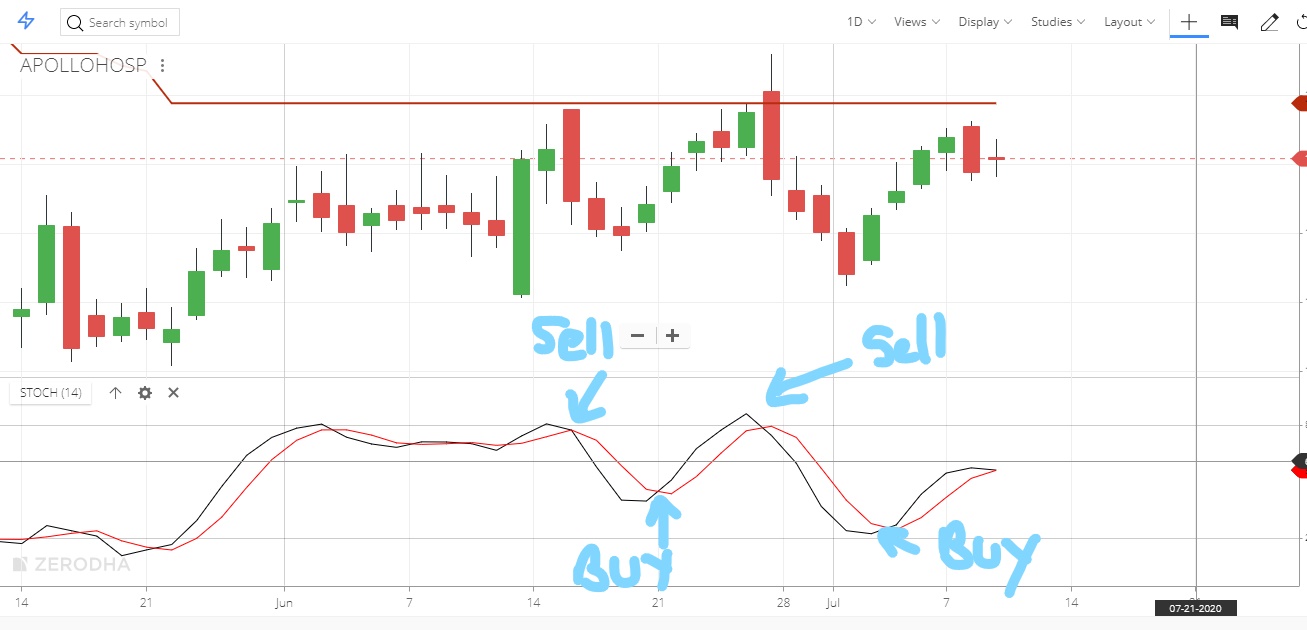
5:- Stochastic/RSI Should be selected form studies in kite chart
Stochastic or RSI should be in (14 80 & 20 ratio) here you can check if stochastic is at 20 level then it’s a chance to going up or if it is in 80 than its a chance to go down.
Note: – Time interval 5mint 10mint or 30 mint for intraday and 1d for positional trader,also check
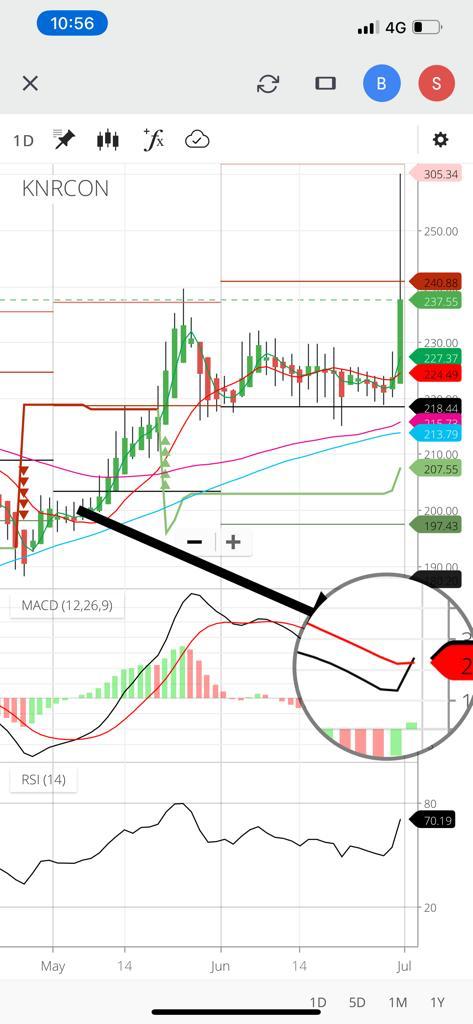
Here Macd plays a vital rule in selecting or identifing the exact movement of the stock but its signal line and crossover line , Below screen shot clearly show that the stock will move upwards in 1d candle.
US market previous day movement (DOW & NASDAQ)
Lastly save this setting with name MY STRATEGY on view section (right corner in kite)
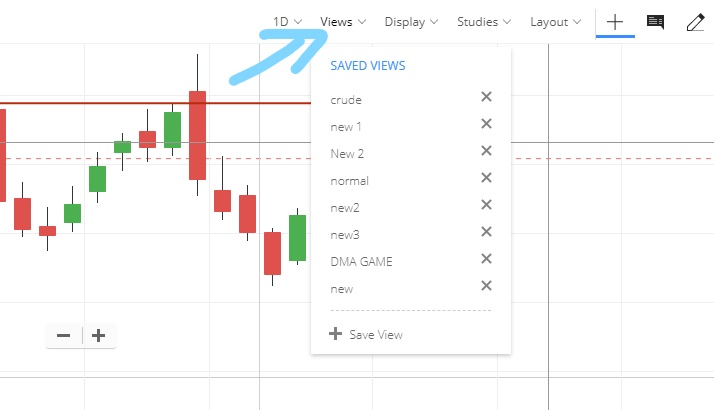
If you dont save and open the chart from mobile then setting will go automatically. For that you need to do it again. So better save the setting.
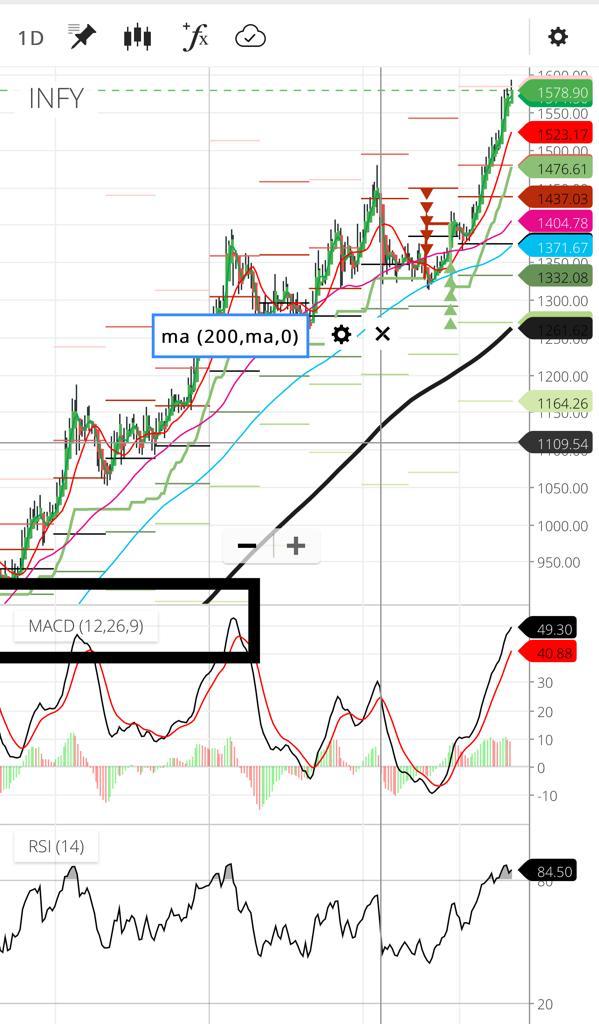
After Saving you will be able to see like this, Below Screen shot show that RSI is over brought and we are not entering in this stock as of now.
We assure if you follow our rules then you can earn 1K to 5K daily.
Watch all videos that we already mentioned in this channel MarketGurukul.com
Dont Forget to Select candle stick time frame 5-10-30 for intraday and 1d for Delivery chart
Note:- Check the delivery percent in NSE WebsiteBy clicking on Security-wise Delivery Position (30-Jun-2021 00:00:00)
Some Important Website from which we study in ragularly
